Congenital Disorders of Glycosylation – Unravelling the correlation between different ER-based types of glycosylation via glyco/proteo-analytics

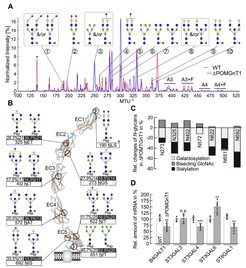
Deficiency in POMGNT1 affects N-glycosylation of N-cadherin. A, comparative overlay of the electropherograms as obtained by xCGE-LIF after APTS labeling to evaluate N-glycan profile of N-Cdh derived from WT (red line) and ΔPOMGnT1 (blue line) HEK293T cells. The normalized signal intensity of APTS-labeled N-glycans (relative signal intensity (%), i.e., peak signal divided by the summed peak height of all quantifiable N-glycan peaks with signal-to-noise ratio >9) is plotted over their normalized migration time units (MTU”). Relevant peaks are numbered and annotated with corresponding glycan structures. A3 and A4 indicate three- and four-antennary N-glycan structures, respectively; while F indicates the presence of a fucose among the N-glycan structures. The asterisk denotes a peak of an internal migration time standard. B, overview of site-specific N-glycan microheterogeneity on extracellular domains (EC1–EC5) of N-Cdh, purified from WT and ΔPOMGnT1 HEK293T cells. Cartoon represents the molecular structure of five EC domains of N-Cdh, which form a β-barrel structure (brown and blue ribbons represent beta sheet and alpha helix, respectively). The positions of identified N-glycosylation sites are shown in red ribbons. For each N-glycosylation site, the major N-glycoform detected in WT (left) and ΔPOMGnT1 (right) is depicted. Values beneath the each glycan structure represent the relative abundance of this N-glycoform (quantitative values for each glycoform as proportions relative to the sum of all glycoforms detected) and the total of N-glycoforms detected on this site, respectively. Values for ΔPOMGnT1 are highlighted in black. Asterisk at position Asn190 indicates the scarcely N-glycosylated site (only one N-glycopeptide derived from WT N-Cdh could be identified). The molecular structure of N-Cdh was modeled by using open-source software UCSF Chimera Version 1.10.2. A, B, N-glycan structures were drawn with GlycoWorkbench Version 1.1, by following the guideline of the Consortium for Functional Glycomics. Pep = peptide moiety; green circle = mannose; yellow circle = galactose; blue square = N-acetylglucosamine; red triangle = fucose; purple diamond = N-acetylneuraminic acid. C, site-specific relative changes in the N-glycan traits (bisecting GlcNAc, sialylation, and galactosylation) in ΔPOMGnT1-derived N-Cdh. For each N-glycosylation site, quantitative changes in the N-glycan microheterogeneity are depicted as increase or decrease in ΔPOMGnT1-derived N-Cdh relative to the level in the WT. The quantities represent N-glycopeptide AUC values (EIC MS1) that were summed based on common N-glycan traits (N-glycopeptides carrying a bisecting GlcNAc, sialylation, and/or galactosylation). Since site N190 is only scarcely N-glycosylated, its microheterogeneity could not be quantified. D, qRT-PCR analysis of galactosyltransferase (B4GALT1) and sialyltransferases (ST3GAL3, ST3GAL4, ST3GAL6 and ST6GAL1) mRNA levels in WT and ΔPOMGnT1 cells. mRNA levels in ΔPOMGnT1 cells are calculated as %, considering the respective mRNA levels in WT cells as 100%. For normalization the housekeeping gene hypoxanthine-guanine phosphoribosyltransferase was used. Assays were performed in triplicate from three biological replicates. Data are represented as means ± SD including all individual data points. Asterisks denote statistical significance in comparison with WT cells: ** p ≤ 0.01, *** p ≤ 0.001, n.s. not significant.
A patient-based medaka alg2 mutant as a model for hypo-N-glycosylation. Development 148 (11), dev199385 (2021)
Glycosyltransferase POMGNT1 deficiency strengthens N-cadherin-mediated cell-cell adhesion. Journal of Biological Chemistry 296, 100433 (2021)
A spoonful of L‐fucose—an efficient therapy for GFUS‐CDG, a new glycosylation disorder. Embo Molecular Medicine 13 (9), e14332 (2021)
